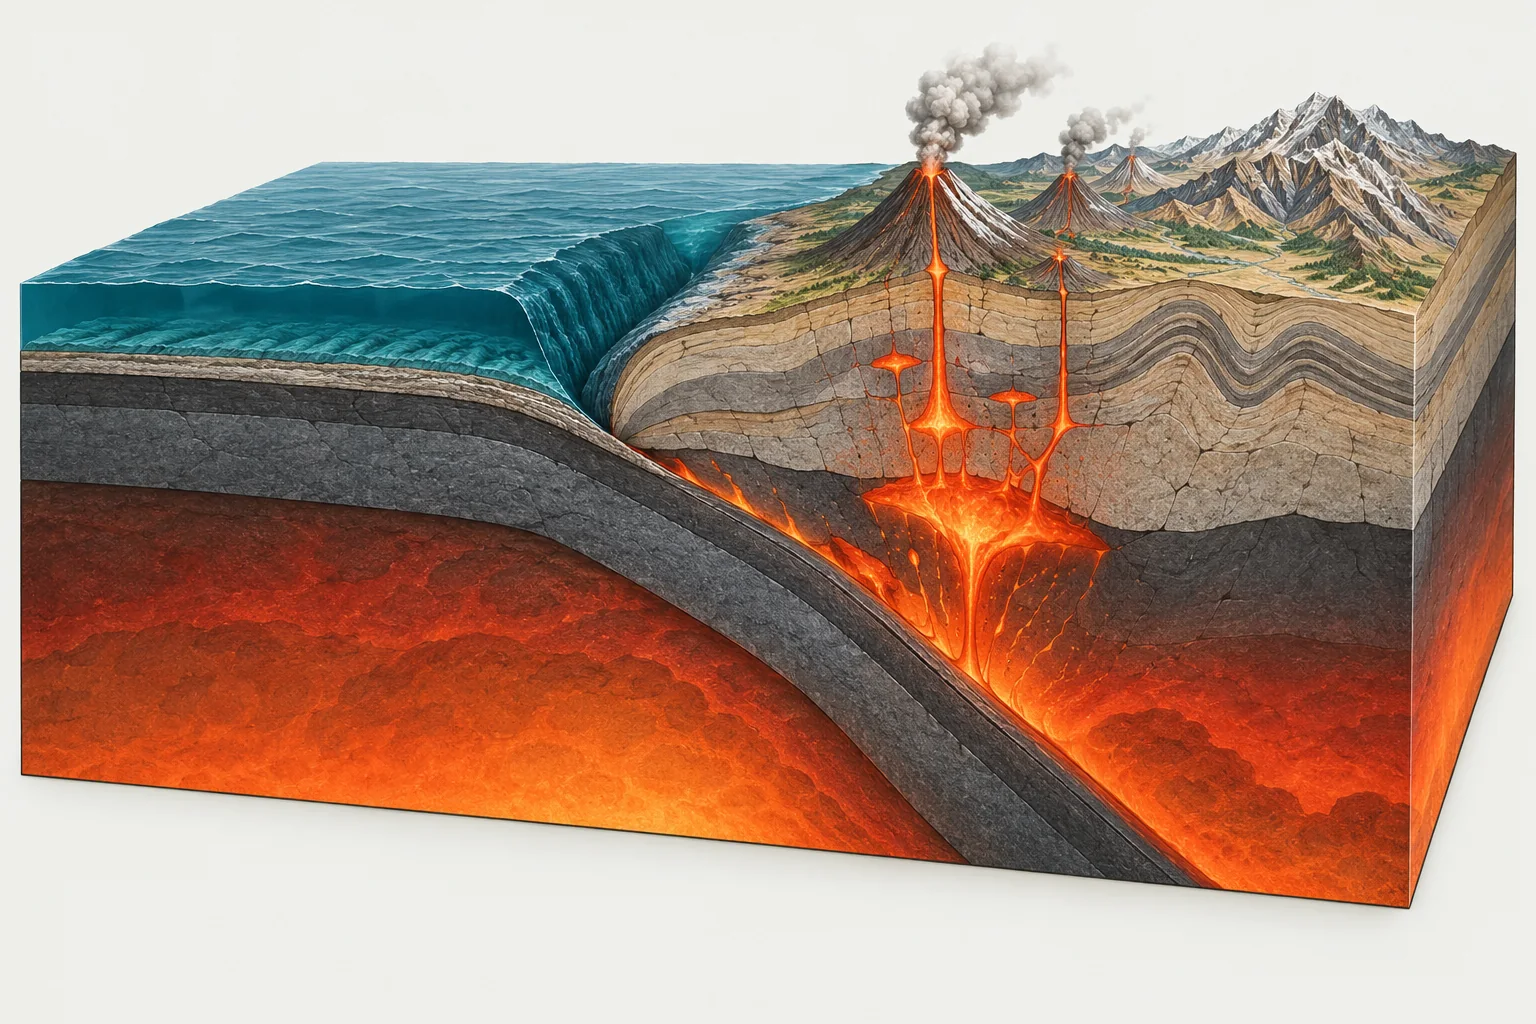
Convergent · Plates collide
One plate dives under another at a subduction zone, or two continents crumple into mountains. The world's biggest earthquakes happen here.
91,920 km 35% of all boundaries
Convergent boundaries explainedAn interactive world map of all 52 tectonic plates. Click a plate to see its size, speed, neighbors and countries.
The seven major plates cover 81% of the planet. The rest are smaller blocks caught between them, many no bigger than a country.
Major plates 7
Minor plates 13
Microplates 32
260,794 km of plate boundaries wrap the globe. Each stretch is one of three types, and the type decides whether you get trenches, ridges or faults.
One plate dives under another at a subduction zone, or two continents crumple into mountains. The world's biggest earthquakes happen here.
91,920 km 35% of all boundaries
Convergent boundaries explained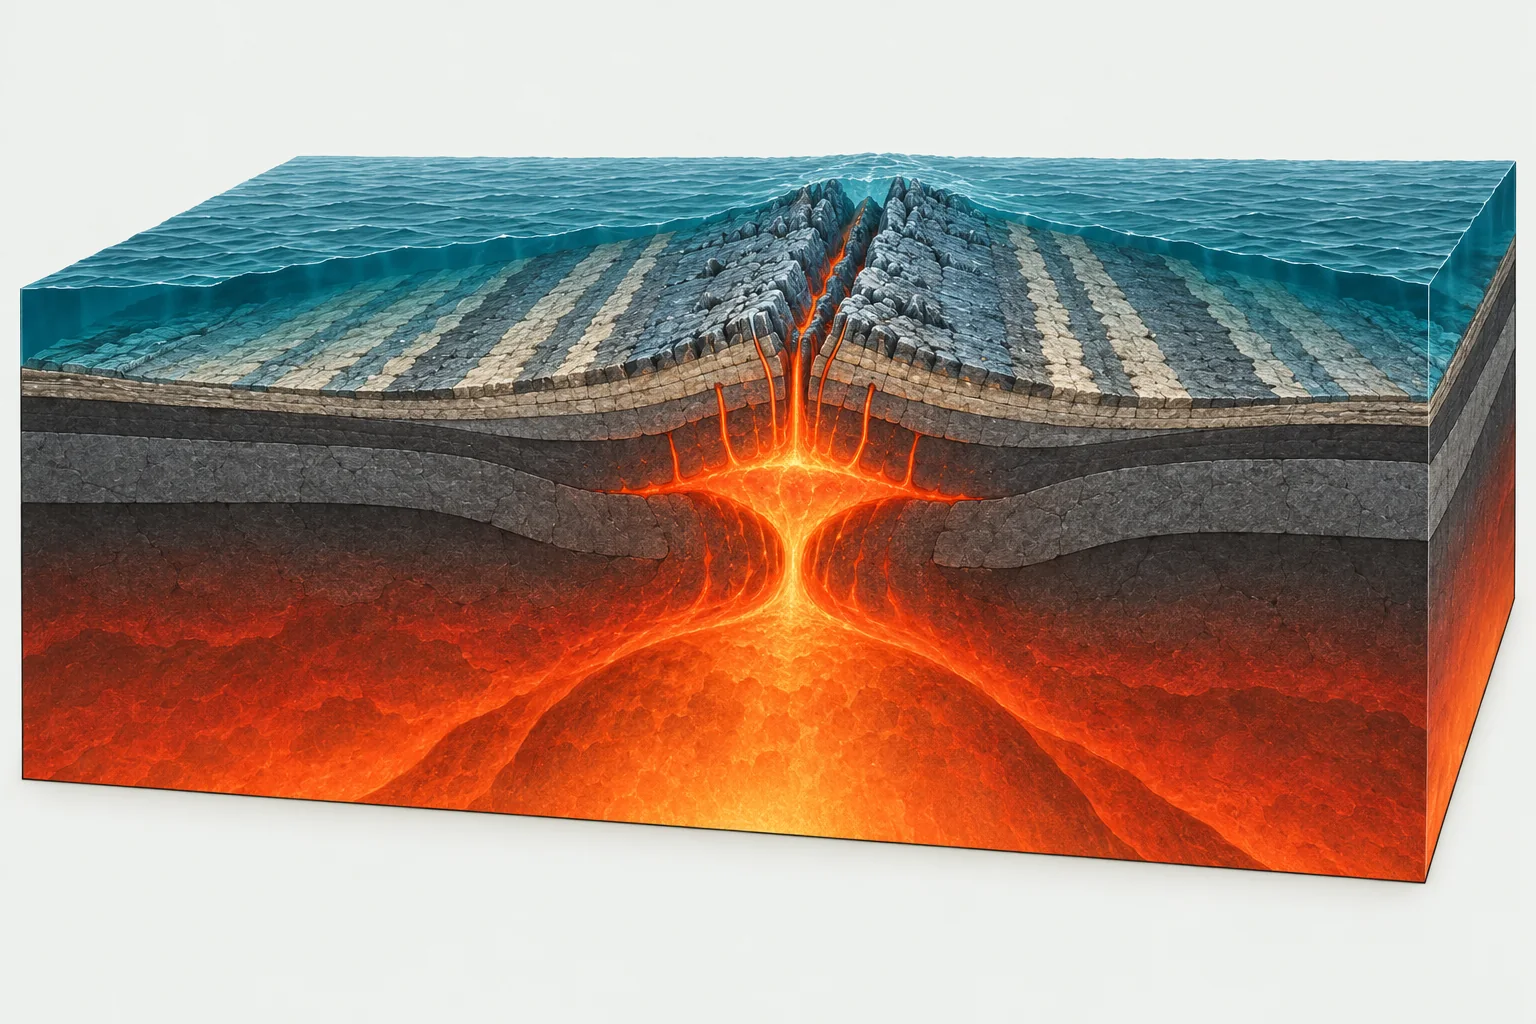
Magma rises to fill the gap and builds new crust, mostly along mid-ocean ridges. On land the same process opens rift valleys.
94,806 km 36% of all boundaries
Divergent boundaries explained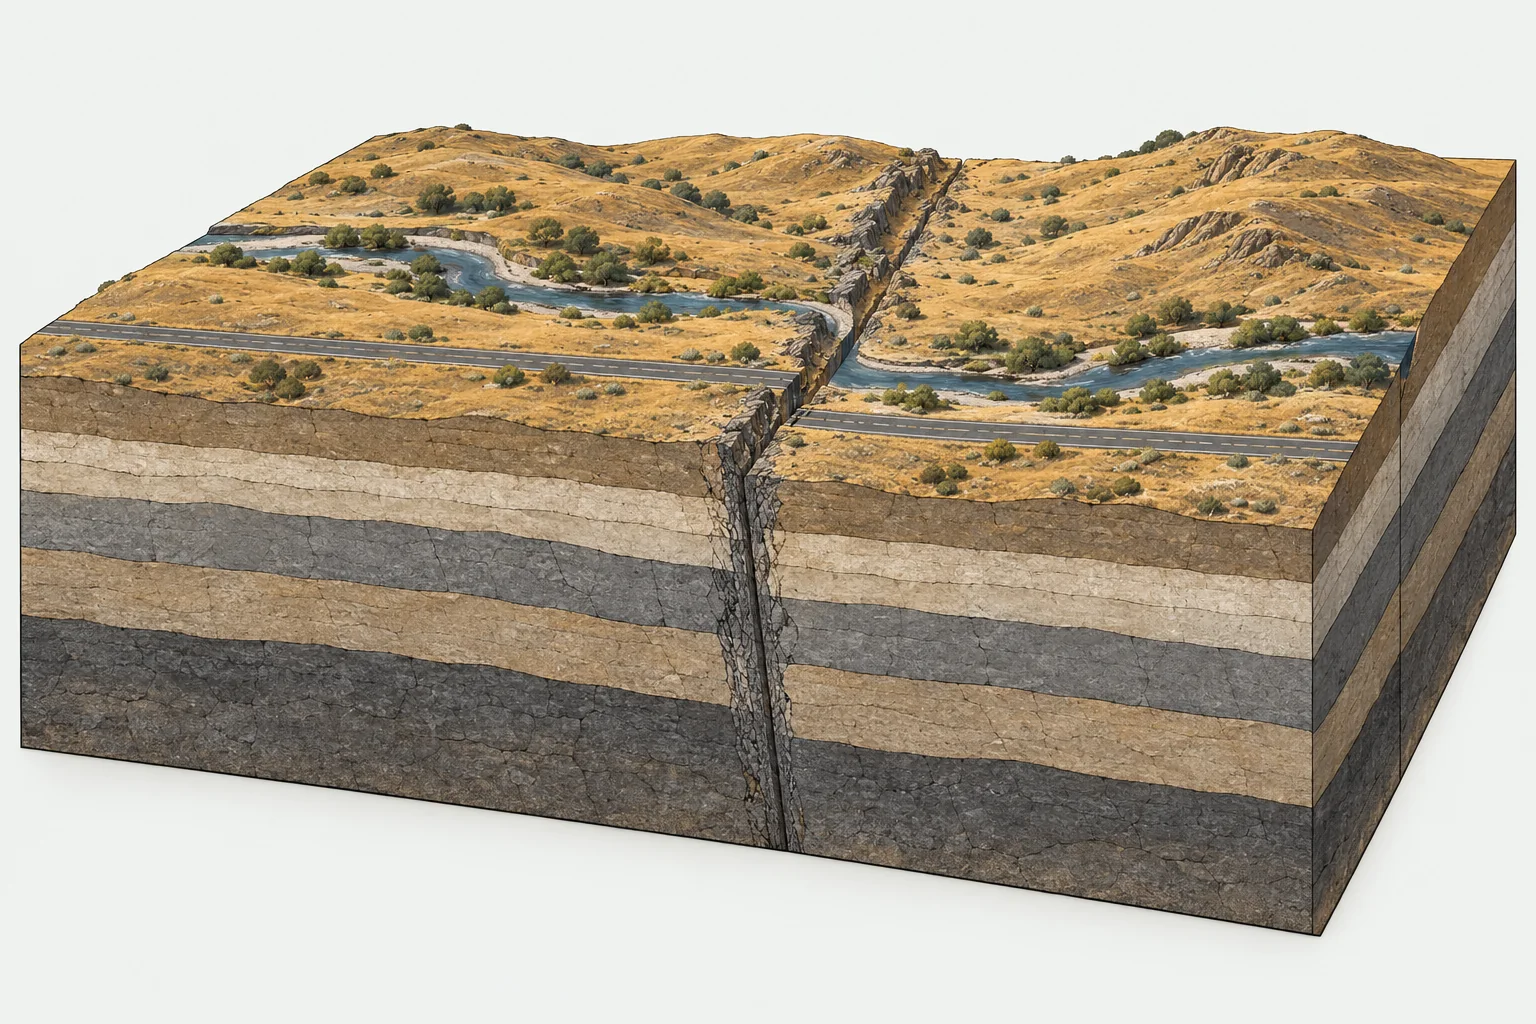
Crust is neither made nor destroyed. The plates grind sideways along faults that store strain and release it in shallow quakes.
74,068 km 28% of all boundaries
Transform boundaries explainedAll ten struck on convergent boundaries, where one plate sinks beneath another.
| # | Earthquake | Magnitude | Year | Plate | Country |
|---|---|---|---|---|---|
| 1 | Great Chilean Earthquake (Valdivia Earthquake) | M9.5 | 1960 | South American | Chile |
| 2 | Prince William Sound, Alaska Earthquake | M9.2 | 1964 | North American | United States |
| 3 | Sumatra - Andaman Islands Earthquake | M9.1 | 2004 | Burma | Indonesia |
| 4 | Great Tohoku Earthquake, Japan | M9.1 | 2011 | Okhotsk | Japan |
| 5 | 89 km ESE of Petropavlovsk-Kamchatsky, Russia | M9.0 | 1952 | Okhotsk | Russia |
| 6 | Ecuador-Colombia Earthquake | M8.8 | 1906 | North Andes | Ecuador |
| 7 | Maule, Chile Earthquake | M8.8 | 2010 | South American | Chile |
| 8 | Kamchatka Peninsula, Russia Earthquake | M8.8 | 2025 | Okhotsk | Russia |
| 9 | Western Aleutian Islands (Hawadax/Rat Islands) Earthquake | M8.7 | 1965 | North American | United States |
| 10 | Unimak Island, Alaska Earthquake | M8.6 | 1946 | North American | United States |
Source: USGS earthquake catalog. Plate assigned by epicenter location.
Today's earthquakes, eruptions, storms and auroras, each drawn on top of the plate boundaries that explain them.
A plate tectonics map shows how Earth's rigid outer shell, the lithosphere, is broken into tectonic plates and where those plates meet. Instead of roads and cities it draws the edges of the plates: the ocean trenches where one plate dives beneath another, the mid-ocean ridges where new crust is born and the long faults where two plates grind sideways. Put those lines next to earthquakes and volcanoes and the logic of the planet becomes visible at a glance: almost every strong earthquake and most volcanoes sit on or near a boundary.
This plate tectonics map of the world is built from the PB2002 model by the geophysicist Peter Bird, the most widely used global set of plate boundaries in research and teaching. It divides the surface into 52 plates: 7 major plates such as the Pacific, North American and Eurasian plates, 13 minor plates and 32 microplates squeezed into the busiest collision zones. Every line and every number on the page comes from that published dataset, drawn on NASA satellite imagery so you can see the trenches and ridges in the sea floor itself.
The interactive plate tectonics map at the top of this page works on phones, tablets and desktop computers, with nothing to install. Drag to move around, scroll or pinch to zoom, and click any plate to open its card: area, share of Earth's surface, average and fastest boundary speed, the number of large earthquakes and volcanoes on it, its neighbors and the countries it carries. The search box finds any plate or any of 213 countries, and the full plate profile is always one click away.
Open the Layers menu to switch on every magnitude 7 or larger earthquake since 1900 and the 1,214 volcanoes that have erupted in the last 12,000 years. With both layers on, the global plate tectonics map becomes a lesson of its own: the dots trace the plate edges almost perfectly, especially around the Pacific Ring of Fire, while the stable interiors of the plates stay nearly empty.
This is a plate tectonics map with boundaries colored by type, so you can tell what every edge is doing:
Together they form 260,794 km of plate boundaries around the world. Diagrams of all three types are shown above, and our guide to plate boundaries explains each one in depth with examples.
Most school maps show about 15 plates. Bird's model is more detailed because earthquake locations and GPS measurements show that regions such as Indonesia, the Andes, Papua New Guinea and the Aegean Sea move as separate blocks. The seven major plates are the same in both versions, so this world plate tectonics map works for a quick overview as well as for a close look: zoom out and the big plates with their names in capitals dominate, zoom in and the microplates appear. The list of all 52 tectonic plates ranks them by size and links to every profile, and how many tectonic plates there are explains why different maps give different totals.
Textbooks often show a plate tectonics map with arrows to show which way the plates move. Those arrows always describe motion relative to something, usually a neighboring plate, and this map gives you the numbers behind them. Every plate profile describes its direction of motion in plain words, and its boundary table lists the relative speed against each neighbor, from less than a centimeter a year to 26.3 cm/yr at the Tonga Trench, the fastest plate boundary on Earth. Students can turn those numbers into their own arrow map: the blank printable map below is made for exactly that activity.
For the classroom there are four free printable plate tectonics maps: a labeled plate tectonics map in color, the same labeled map in black and white, and two blank plate tectonics map worksheets without names for quizzes and labeling exercises. They are vector files, so they print sharp on A4, Letter or poster paper. Popular plate tectonics map activities include labeling the seven major plates, coloring the three boundary types, marking famous volcanoes and earthquakes from the live maps and drawing arrows for plate motion. Each worksheet pairs well with a boundary diagram from our guides to convergent, divergent and transform boundaries.
Every plate has its own page with a regional locator map, statistics and a plain-language profile. The Caribbean plate tectonics map on the Caribbean Plate page, for example, shows how the plate is squeezed between North and South America, with the Puerto Rico Trench along its northern edge and the volcanic islands of the Lesser Antilles on its eastern side. You can also start from where you live: plates by country answers which plate lies beneath each of 213 countries and territories, and Find my plate checks your exact location and measures the distance to the nearest boundary.
Plates move only a few centimeters a year, but their effects happen every day. Our live maps draw today's data on the same plate boundaries: earthquakes from the US Geological Survey, refreshed every minute, and volcanoes filtered by their last eruption. Leave the earthquake map open for a day and the outline of the plates appears on its own.
Plate outlines, boundary types and relative speeds come from PB2002 (Bird, 2003, Geochemistry, Geophysics, Geosystems). The satellite imagery is NASA's Blue Marble, historic earthquakes come from the USGS catalog, volcanoes from the Smithsonian Global Volcanism Program and country outlines from Natural Earth. We compute plate areas, boundary lengths and the countries on each plate ourselves; the sources and methods page documents every step.
A plate tectonics map shows the tectonic plates that make up Earth's outer shell and the boundaries where they meet: convergent boundaries where plates collide, divergent boundaries where they pull apart and transform boundaries where they slide past each other. This interactive plate tectonics map of the world also shows historic earthquakes and volcanoes, which cluster along those boundaries.
There are 7 major plates and many smaller ones. The PB2002 model used on this map counts 52: 7 major plates, 13 minor plates and 32 microplates. See the full list.
Yes. The interactive map, every plate and country page, the live maps and the printable maps are free to use, with no sign-up. It works in any modern browser on phones, tablets and computers.
Orange-red lines are convergent boundaries, where plates move toward each other. Teal lines are divergent boundaries, where they move apart. Dashed lines are transform boundaries, where they slide past each other. Plate boundaries explained.
Each plate page describes which way the plate moves and lists its speed relative to every neighbor, the numbers that arrows on textbook maps stand for. Speeds range from under 1 cm a year to 26.3 cm/yr at the Tonga Trench. The blank printable map is designed for drawing your own motion arrows.
The printable maps page has free labeled and blank plate tectonics map worksheets in color and in black and white. They are vector files that print sharp at any size and are free for classroom use.
The Pacific Plate, at about 104.6 million km². It covers roughly 21% of Earth's surface.
Most plates move 2 to 10 cm a year relative to their neighbors, about as fast as fingernails grow. Mid-ocean ridges in the PB2002 model spread at an average of 4.7 cm/yr. The fastest motion on Earth is at the Tonga Trench, where relative speeds reach 26.3 cm/yr.
Use Find my plate to check your location against the PB2002 plate outlines, or look up any country in the plates by country list.
Plate outlines and boundary types come from Peter Bird's PB2002 model (2003), published in Geochemistry, Geophysics, Geosystems. Earthquakes come from the USGS catalog and volcanoes from the Smithsonian Global Volcanism Program. Sources and methods.